





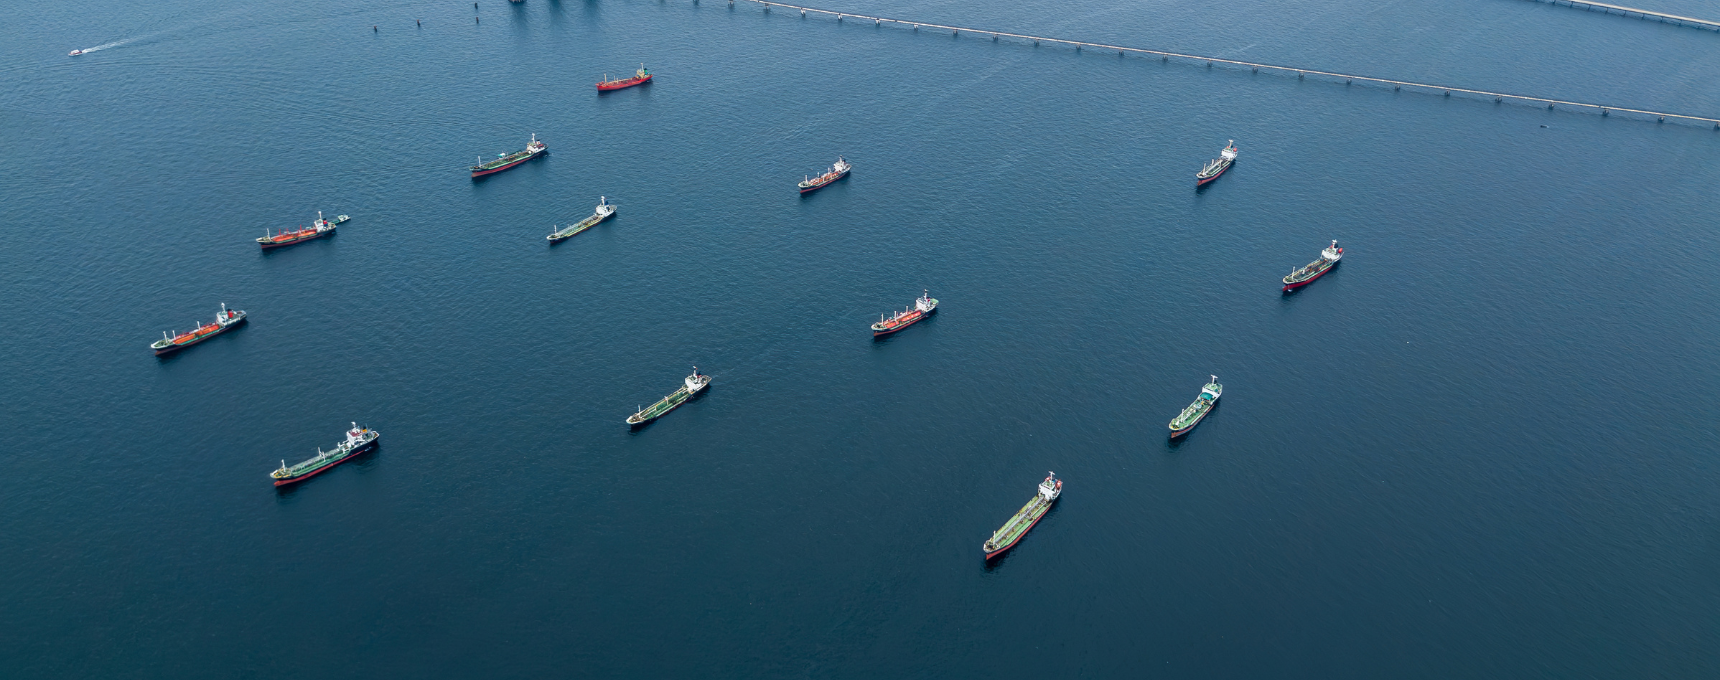
Every hour a vessel sits at anchor, the meter is running. Not slowly, not invisibly, but across five simultaneous cost layers that compound in real time. For vessels and shipping companies operating in European waters, 2026 marks a turning point: the EU Emissions Trading System now covers 100% of verified emissions from EU port calls, adding a carbon invoice to a bill that was already substantial.
This article breaks down what one hour at anchorage actually costs, by vessel class, across each cost layer, and explains why the calculation is more urgent today than it has ever been.
The meter is always running
Anchorage feels like a pause. The voyage is over, the berth is almost ready, the cargo operations are close. But from a commercial and operational standpoint, a vessel at anchor is not pausing, it is spending. Charter rate exposure does not stop at the pilot boarding place. Auxiliary engines burn fuel to maintain power, lighting, ventilation and safety systems. The demurrage clock may already be ticking. And from 1 January 2026, every tonne of CO₂ emitted while waiting carries a real monetary cost under the EU ETS.
Operators who have run the numbers already know this intuitively. The goal of this article is to make the calculation explicit, so that the cost of anchorage time can be weighed against the cost of the coordination tools that reduce it.
Breaking down the bill: five cost layers
The following figures are indicative ranges by vessel class. All figures should be verified against current market rates at time of use.
1. Bunker burn at auxiliary load
A vessel at anchor is not at rest. Auxiliary engines run continuously to maintain essential systems. Typical auxiliary consumption ranges from 0.5 to 2 metric tonnes per hour depending on vessel size. At a VLSFO price of approximately $464/tonne (EMEA, end-2025), that translates to:
- Small/medium tanker (MR): ~$230–460/hr in auxiliary bunker alone
- VLCC: up to ~$930/hr
At EU ETS carbon prices of approximately €70–80/tonne CO₂ (early 2026, verify before publishing), each tonne of VLSFO burned at anchor generates roughly 3.2 tonnes of CO₂, adding approximately €224–256 per tonne of fuel consumed in carbon charges.
2. Charter rate / time-charter exposure
The charter party clock does not stop at anchor. Based on Compass Maritime weekly rates (verify at time of publish):
- VLCC (12-month T/C ~$110,500/day): ~$4,600/hr
- Suezmax (~$58,000/day): ~$2,400/hr
- MR (~$26,250/day): ~$1,094/hr
- Smaller/inland tankers (Neste Business Case benchmark): ~$1,000/hr
For a VLCC waiting 50 hours at anchor, a scenario documented in ARA port data, charter rate exposure alone reaches approximately $230,000.
3. Vessel OPEX
Crew costs, maintenance, insurance and management fees continue regardless of vessel position. Based on Okeanis Eco Tankers Q4 2024 actual fleet data: approximately $8,321/calendar day (~$347/hr) in vessel OPEX. This is the baseline that applies to every idle hour, independent of cargo or charter arrangements.
4. Demurrage accumulation risk
Where the vessel has arrived within laytime, the demurrage clock is running, or is about to run. Indicative benchmark rates by vessel class:
- VLCC: $50,000–$80,000/day ($2,000–3,300/hr)
- MR/Handysize: $5,000–$10,000/day ($208–416/hr)
Demurrage is commercially sensitive and varies by charter party. What matters here is that each hour of avoidable anchorage waiting is a direct exposure window. UAB-Online's own data shows that digital pre-arrival coordination reduces demurrage claims, not by eliminating disputes, but by removing the documentation gaps and timing mismatches that give rise to them.
5. EU ETS carbon charge (new from 1 January 2026)
From 1 January 2026, 100% of verified CO₂ emissions from EU port calls are covered under the EU ETS. For a vessel idling at anchor near an EU port, every hour of auxiliary engine operation now generates a carbon cost that did not exist at full weight before 2026.
At an EUA price of approximately €70–80/tonne, and auxiliary consumption of 1–2 MT/hr, the carbon charge per hour of anchorage ranges from roughly €224 to €512 for a mid-size tanker.
What the data says: ARA port benchmarks
These are not abstract calculations. ARA terminal performance data from 2025 puts concrete numbers on the scale of the problem.
- Average terminal turnaround time: 64 hours in Rotterdam, 74 hours in Antwerp, 94 hours in Amsterdam
- Moored time as a share of total turnaround: only 40–80%, meaning 20–60% of the total vessel experience is non-productive time
- Waiting before berth when berth is occupied on arrival: average 40.5 hours, compared to 17.3 hours when the berth is available
One documented case, the vessel Dorado Chem at an ARA terminal in August 2025, shows 50 hours of waiting, with an associated charter cost of €150,000–€185,000, 60–70 tonnes of fuel consumed and 180–220 tonnes of emissions generated. A well-coordinated arrival the same quarter (Thale Victory, December 2025) waited just 2 hours, with charter exposure of €110,000–€140,000 and 40–50 tonnes of fuel.
The difference between those two calls, 48 hours of anchorage time, represents, at VLCC charter rates, approximately $220,000 in avoided cost. At MR rates, approximately $52,500. Across a fleet, or across a season, these numbers multiply significantly.
The UMAS Port Congestion and Waiting Times Report (2024) confirms that chemical tanker, liquefied gas tanker and bulk carrier segments all showed a net increase in the proportion of time spent waiting at anchor between 2018 and 2022. This is not a temporary disruption; it is a structural feature of current port call operations.
Why the calculation matters right now
Two forces make 2026 the right moment to run these numbers properly.
EU ETS at 100%.
From 1 January 2026, shipping's carbon cost exposure is no longer partial. The phase-in period is over. Every tonne of CO₂ emitted at or near an EU port is fully covered. The PortXchange JIT analysis estimated that applying JIT arrivals to a sample of 323 vessels could have saved 1,141 tonnes of CO₂ and 358 tonnes of bunker fuel, translating to approximately €99,539 in carbon credits for a single major carrier across a seven-month dataset. At 100% EU ETS coverage, those numbers are proportionally larger.
JIT data quantifies the opportunity.
According to a PortXchange Untapped white paper that found the same dataset represented over $6 million in potential fuel savings. UAB-Online's pre-arrival process delivers an average of 45–90 minutes of port stay reduction per vessel visit. At the hourly rates set out in this article, that is not an estimate, it is a calculable avoided cost.
Operators who can run this calculation have the evidence base to make the investment case for better coordination. Those who cannot are absorbing a cost they cannot see.
The lever operators already have: pre-arrival coordination
The operational lever is not new. But its financial impact is now larger and more precisely measurable.
Digital pre-arrival documentation, early Notice of Readiness (NoR), and shared berth readiness planning are the mechanisms that shorten anchorage time. When documentation is exchanged before arrival, rather than at the berth, the ISGOTT 6 Ship/Shore Safety Check List (SSSCL) is completed in advance, deviations are identified early, and the vessel arrives at a terminal that is genuinely ready.
The UAB-Online pre-arrival process reduces port stay by 60–90 minutes per call, reduces demurrage claims and cuts email and phone traffic significantly. A digital NoR submission reduces idle time in port directly. Spreading activities to the pre-arrival phase removes the bottleneck that builds up when a vessel arrives and all coordination begins at once.